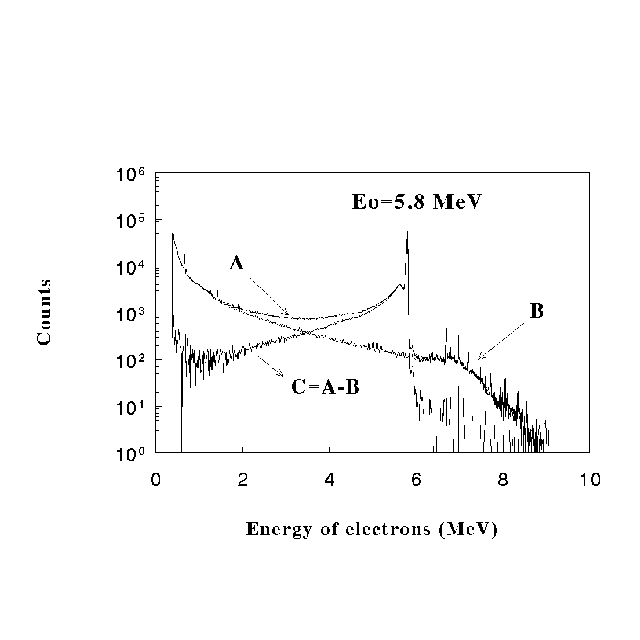
Fig. 1 The HPGe response for 5.8 MeV electron energy:
A - original spectrum, B - background spectrum
C - 'pure' response spectrum
FOR NUCLIDES CLOSE TO 132 Sn.
B. Fogelberg and L. Spanier
Uppsala University, Department of Neutron Research,
S-61182 Nykoping, Sweden
K.A. Mezilev, Yu.N. Novikov and A.V. Popov
St.Petersburg Nuclear Physics Institute,
188 350 Gatchina, Russia
1. Introduction.
The purpose of these measurements was the improvement of the accuracy for atomic masses in the vicinity of 132Sn. The Q-beta values were derived from the experimental endpoint values for beta spectra obtained using HPGe detector as a beta-spectrometer. The high efficiency and the rather high resolution power of this detector are very important for measurements far from the valley of beta-stability, where the production rate of nuclides is usually very low. Very often for nuclides with high beta decay energies we can use rather wide range of beta spectra to extract the endpoint value with a good accuracy. The most important characteristic of a beta spectrometer in that case is the detector response, which could be an origin of systematic errors.
2. The measurement of beta decay spectra.
The isotopes of In, Sn, Sb of atomic numbers within A=131-134 have been obtained as isotope separated fission products at the OSIRIS ISOL facility [1] in Studsvik. The moving tape collector was used for the deposition of radioactive ion beam between two detectors for gamma and beta radiation. The measurement mode was both as single one and as beta - gamma delayed coincidences. Special precautions were taken to reduce the pile-up effect to prevent a distortion of the high energy part of beta spectra with rather low statistics.
The HPGe detector, which was used for beta spectra measurements has been calibrated using the gamma lines of standard gamma sources and using well known high energy lines of short lived isotopes produced on-line.
The collected data have been sorted after the experiment using the gates in gamma spectra to select the beta transitions, which feed the well known levels of a doughter isotope. For each gate of gamma peak two additional gates have been used to subtract the background.
3. The response function of HPGe detector.
The response function of the hyperpure germanium detector (HPGe),
which was used as the beta spectrometer, has been determined by means of the
monoenergetic electrons after the
exit slit of the BILL spectrometer at the ILL in Grenoble.
The spectrometer target located close to the reactor core emits electrons
for BILL in the energy range up to 10 MeV. The measurements without electrons
at the BILL exit slit were undertaken to take into account the background
at the detector area ( Fig.1 ).

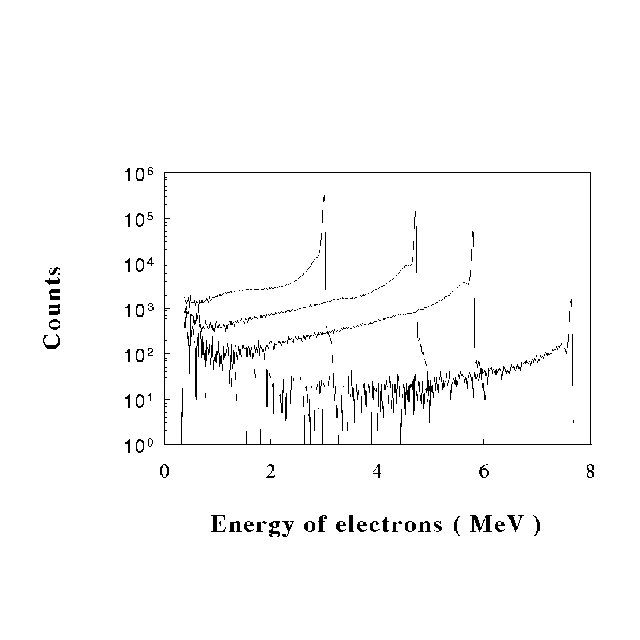
The response spectra have been measured for
different electron energies within the interval of 1.6 - 8.5 Mev
( Fig.2 ).

The "pure" response function spectrum could be very obviously represented as a composition of three main parts. All these parts of the response were represented in analytical way as functions of energy:
where
R - total response normalised to the unit,
P - main peak,
H - bremsstrahlung hump,
T - low energy tail,
E - energy of electrons hitting the detector,
E' - energy lost in the detector.
4. The evaluation of endpoint energies and the procedure of beta spectra correction.
To evaluate the endpoint energy values we have used the Fermi - Kurie representation of the beta spectra after the correction by the detector response. For allowed beta transitions the strait line fit was used to find the endpoint for the high energy component of the spectra. The error of the endpoint value was obtained as a result of the least square method. This error takes into account the background subtraction.
The influence of the parameters uncertainty of the response function
fit on the calculated endpoint value has been studied. The fit of RF contains
six main parameters, which are functions of energy. These functions could
be fitted with a different accuracy. It means that we should take into
account the influence of the correction procedure on the accuracy of
the endpoint. We have found the most sensitive parameters, which are
responsible for the main part of the endpoint error that we have after
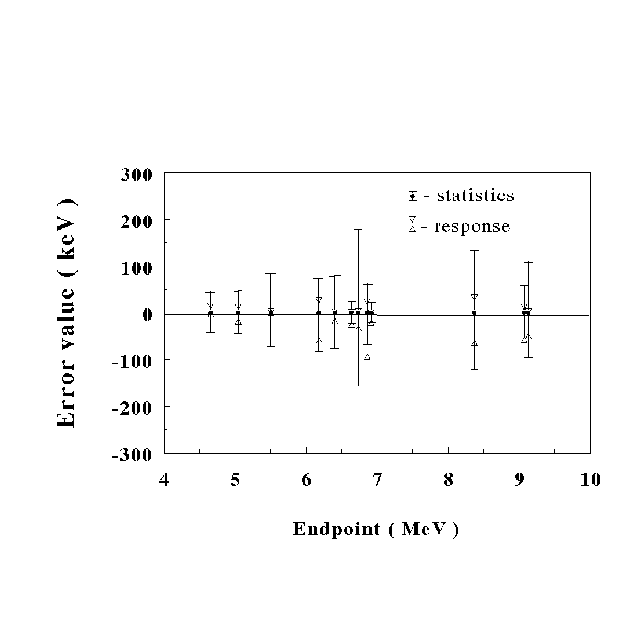
the spectrum correction. There were found not only the statistical errors
for the endpoint values, but also the errors of the correction procedure
( Fig. 3 ).

5. Results.
The obtained results are presented in Table 1. For each isotope the endpoint energies of beta branches fed well known levels were averaged to deduce the Q-beta value and to compare with data from other publications. For some values the accuracy is considerably improved as compared to previous works [2].
| Nuclide | J |
Gamma gate(keV) |
Endpoint ( keV ) |
Level (keV) |
Q beta (MeV) this work |
Q beta (MeV) other works |
|
131 In |
9/2 + |
2434 3990 4487 |
6640(25) 5045(45) 4655(50) |
2434 3990 4487 |
9.165(30) |
9.184(33) |
|
131 In |
1/2 - | 331 | 9070(60) | 331 | 9.480(70) | 9.547(46) |
|
131 In |
(21/2 +) |
285 2380 158 |
6180(95) 6570(140) 7890(200) |
(6895) 6895 4847 |
13.230(80) |
13.450(163) |
| 132 In | 7 - |
high 1) mid 2) low 3) |
6860(75) 8370(135) 9130(110) |
7211 5629 (4848) |
14.135(60) |
13.600(400) |
| 133 Sn | 7/2 - |
962 5610 5150 |
6920(20) 2270(30) 2760(55) |
962 5610 5150 |
7.990(25) |
7.830(70) |
| 134 Sn | 0 + |
554 872 |
6735(180) 6405(80) |
872 872 |
7.370(90) |
- |
| 134 Sb | 0 - |
- 1352 2631 6451 6687 |
8320(35) 5505(80) 5810(110) 2015(95) 1850(110) |
0 2631 2631 6451 6687 |
8.390(45) |
8.410(110) |
1) 2269+2380 keV; 2) 913+780+710 keV; 3) 132+299+375 keV.
References.
1. L. Jacobsson, B. Fogelberg et al. Nucl.Instr.Meth., B26,223(1986)
2. G. Audi and A.H. Wapstra. Nucl.Phys., A565,1(1993)