Predictions for nPDFs Predictions for impact parameter dependent nPDFs Nuclear diffractive PDFs
Back to V. Guzey at PNPI
Predictions for impact parameter dependent nPDFs
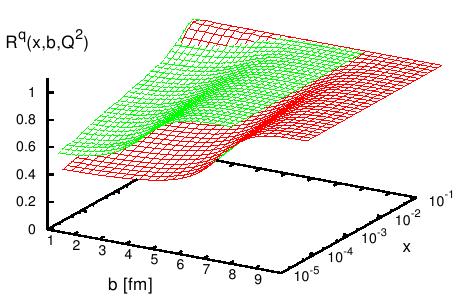
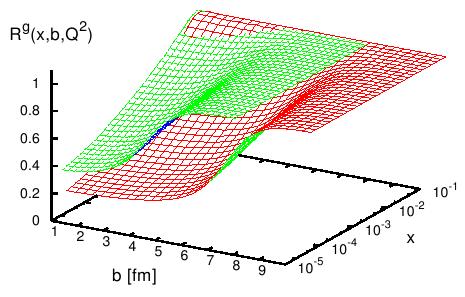
The leading twist model of nuclear shadowing predicts next-to-leading order (NLO) nPDFs and nuclear structure functions for 10-5 ≤ x ≤ 1 and 4 ≤ Q2 ≤ 16,000 GeV2 as a function of the impact parameter b. For the summary of our formalism, see Overview of the formalism .Fortran codes and required data files with grids for nPDFs can be found in the end of this page. An example of our predictions is presented below, where we plot the ratio of the impact parameter dependent nPDFs to the nucleon PDFs,
fj/A(x,Q2,b)/[ATA(b)fj/N(x,Q2)], as a function of x and b at fixed input Q02=4 GeV2. The left plot corresponds to ubar quarks; the right plot corresponds to gluons. The upper green surfaces are for Ca-40; the lower red ones are for Pb-208. In the ratio, TA(b) is the nuclear optical density: TA(b)=\int dz ρA(b,z).
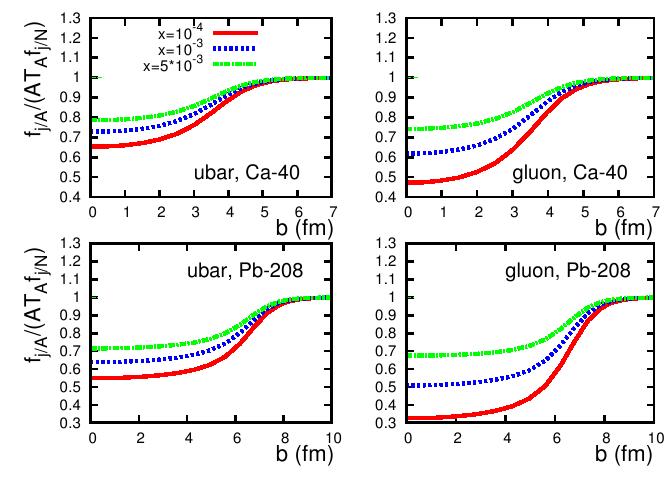
 Taking slices of the 3D plots presented above, one can see better the b dependence of nPDFs; an example is presented below.
 For convenience, we performed the DGLAP evolution using our predictions for impact parameter dependent nPDFs
to several values of Q2 between 4 and 16,000 GeV2 and tabulated our results as a three-dimensional grid
in x, Q2, and b. Using a simple Fortran code, one can interpolate between the grid points and thus obtain NLO fj/A(x,Q2,b)/[ATA(b)fj/N(x,Q2)] and NLO F2A/(ATA(b)F2N) at any desired x, Q2 and b in the interval
10-5 < x < 1,
4 ≤ Q2 ≤ 16,000 GeV2 and 0 ≤ b ≤ 10 fm (10 fm corresponds to Pb-208; the upper limit in b is smaller for
lighter nuclei).
The table below contains the data files with grids and the Fortran codes for the interpolation.
For convenience, we performed the DGLAP evolution using our predictions for impact parameter dependent nPDFs
to several values of Q2 between 4 and 16,000 GeV2 and tabulated our results as a three-dimensional grid
in x, Q2, and b. Using a simple Fortran code, one can interpolate between the grid points and thus obtain NLO fj/A(x,Q2,b)/[ATA(b)fj/N(x,Q2)] and NLO F2A/(ATA(b)F2N) at any desired x, Q2 and b in the interval
10-5 < x < 1,
4 ≤ Q2 ≤ 16,000 GeV2 and 0 ≤ b ≤ 10 fm (10 fm corresponds to Pb-208; the upper limit in b is smaller for
lighter nuclei).
The table below contains the data files with grids and the Fortran codes for the interpolation.
Note that the nuclear optical density is also tabulated; the required data files are found in the table below.
| Nucleus | Model 1 | Model 2 |
| C-12 | Fortran code LT2009_c12_IMPACT_model1.f Grid QCDEvolution_c12proton_2009_IMPACT_model1.dat Data file TA_c12.dat for TA(b) |
Fortran code LT2009_c12_IMPACT_mode12.f Grid QCDEvolution_c12proton_2009_IMPACT_model2.dat |
| Ca-40 | Fortran code LT2009_ca40_IMPACT_model1.f Grid QCDEvolution_ca40proton_2009_IMPACT_model1.dat Data file TA_ca40.dat for TA(b) | Fortran code LT2009_ca40_IMPACT_mode12.f Grid QCDEvolution_ca40proton_2009_IMPACT_model2.dat |
Pd-110 | Fortran code LT2009_pd110_IMPACT_model1.f Grid QCDEvolution_pd110proton_2009_IMPACT_model1.dat Data file TA_pd110.dat for TA(b) |
Fortran code LT2009_pd110_IMPACT_model2.f Grid QCDEvolution_pd110proton_2009_IMPACT_model2.dat |
| Pb-208 | Fortran code LT2009_pb208_IMPACT_model1.f Grid QCDEvolution_pb208proton_2009_IMPACT_model1.dat Data file TA_pb208.dat for TA(b) |
Fortran code LT2009_pb208_IMPACT_model2.f Grid QCDEvolution_pb208proton_2009_IMPACT_model2.dat |